Dashboard Design Skill: a Claude Code skill for clean, honest dashboards
Dashboard Design is a Claude Code skill for clean, honest dashboard user interfaces on the web and in SwiftUI, checked on real screenshots before a job is called done.
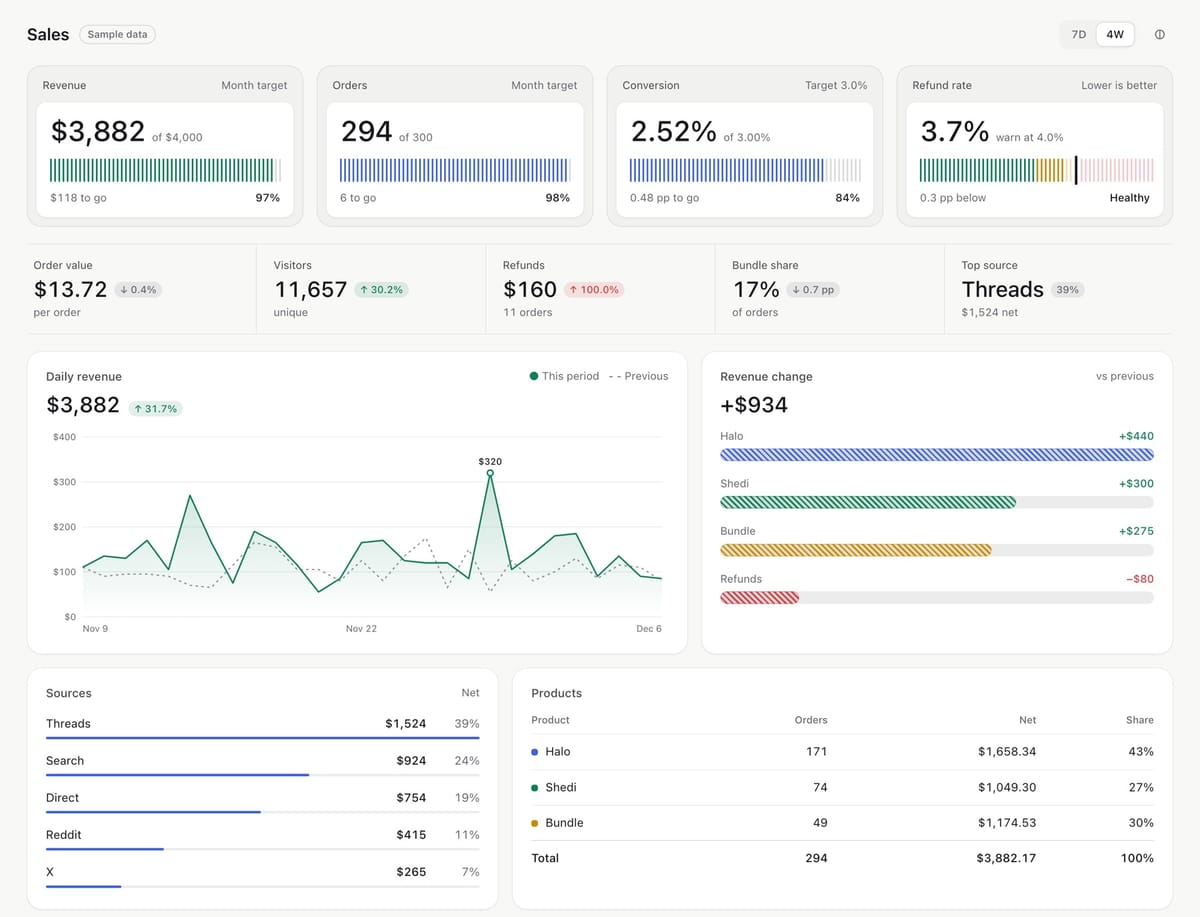
abdiraimov-otabek/dashboard-design-skill gives a coding agent a set of design rules for building, redesigning and critiquing dashboards, instead of leaving the layout, the numbers and the chart choices to chance. The reader who tries it gets a dashboard that is meant to be read at a glance, with the same number everywhere it appears and a screenshot check before the work is called finished.
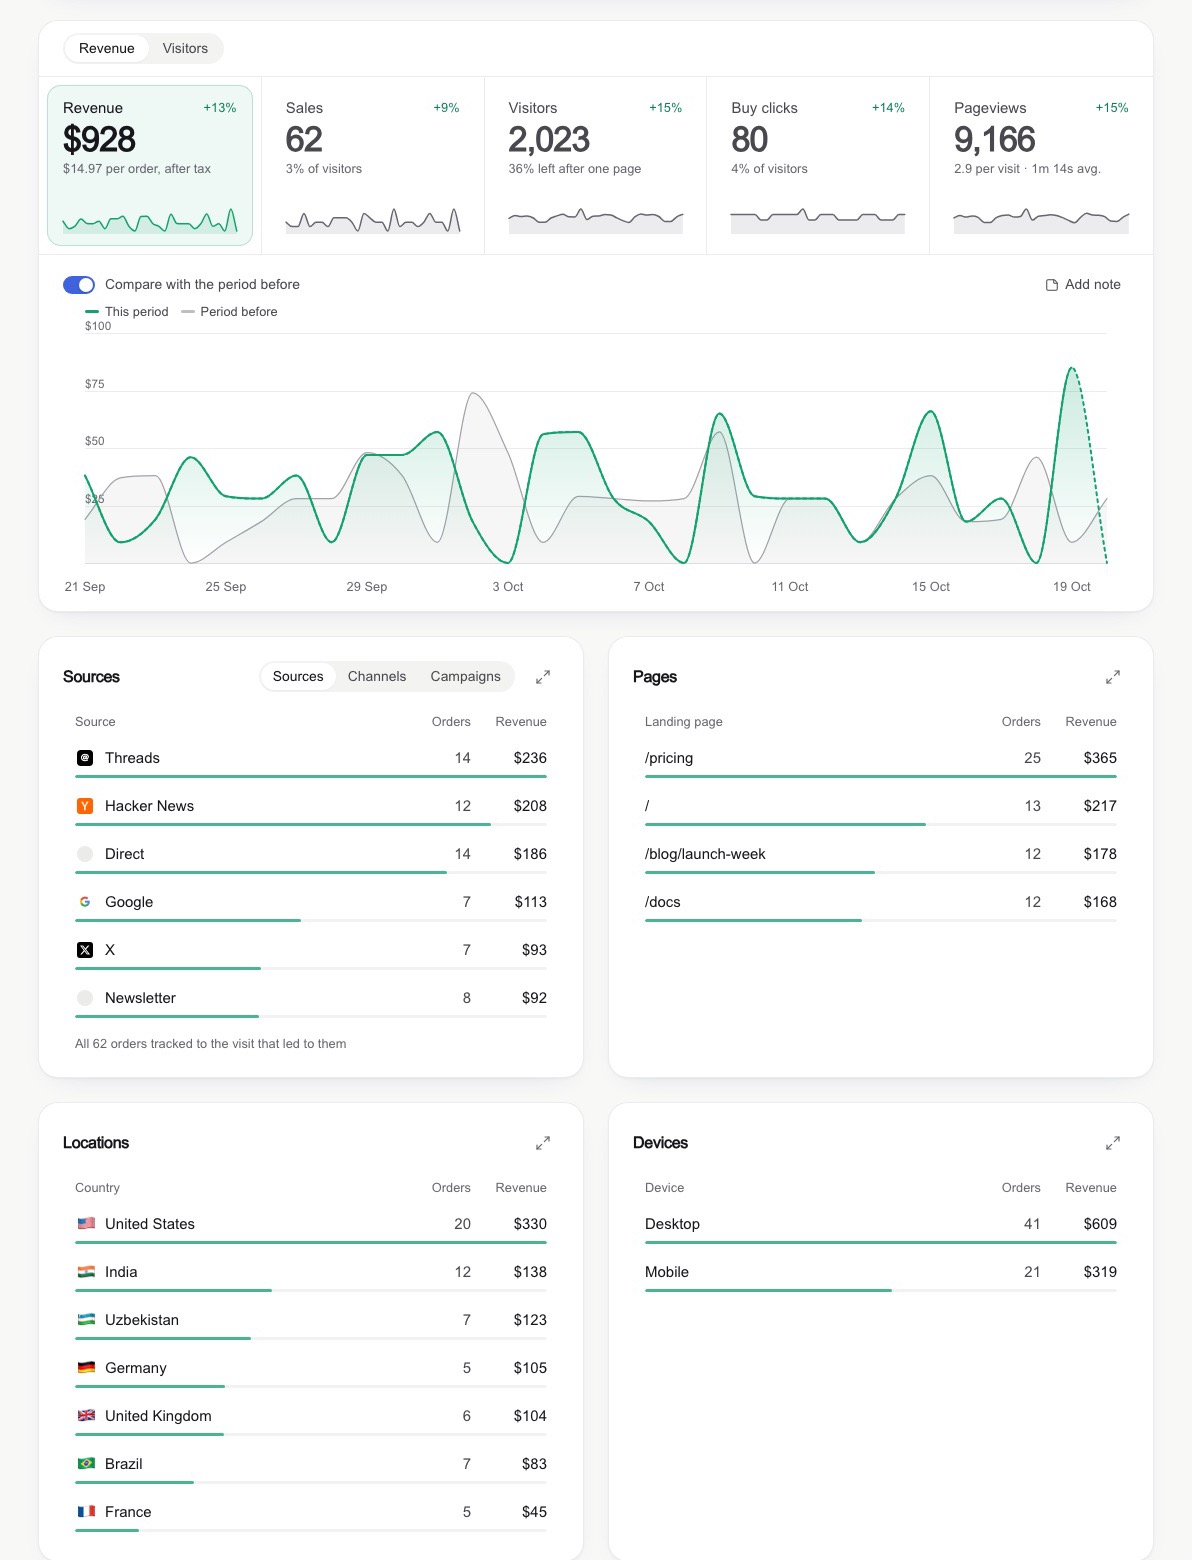
What is Dashboard Design?
Dashboard Design is a Claude Code skill for clean, honest dashboard user interfaces on the web and in SwiftUI.
It covers analytics, revenue, metrics and admin dashboards end to end, including KPI cards, charts, heatmaps, bullet graphs, comparison periods, ranked breakdowns, date range pickers, filters, empty states, and wide and phone layouts. The README says the rules are distilled from 127 shipped dashboard screens, together with the field's classics, six Apple WWDC sessions on charts, chart accessibility and interface writing, two full teardowns, and real redesigns where each rule was broken once, caught on a screenshot, and fixed.
Its guiding ideas are first glance, monitoring, quiet, wordless and honest. One screen answers one question in three seconds, problems are flagged on the data itself with the action beside them, colour is used only where it means something, numbers and shapes stay on the screen while explanations live in tooltips, and the same number is the same everywhere it appears, with estimates labelled and no shouting on tiny bases.
Who is Dashboard Design for?
Dashboard Design is for developers who use Claude Code to build or review a data screen, and for teams whose dashboards need to be checked against what is actually on the screen.
It works in Claude Code as a plugin, and it also works with Codex, Cursor and any agent that reads Markdown, by pointing the agent's AGENTS.md or rules file at skills/dashboard-design/SKILL.md. The web patterns use Tailwind terms with React snippets, and SwiftUI has its own reference using Swift Charts, so the rules port to any stack. The skill is aimed at analytics, revenue, metrics, school and admin dashboards, and at stats pages or any other data-heavy screen.
Is Dashboard Design free and open source?
Yes, Dashboard Design is free and open source under the MIT License, which grants permission free of charge to use, copy, modify, merge, publish, distribute, sublicense and sell copies, subject to including the copyright and permission notices.
It has about 900 GitHub stars as of November 18, 2026. The latest release as of November 18, 2026 is v2.1.0, dated November 9, 2026, and the plugin file also gives the version as 2.1.0. The skill itself is a set of Markdown files: the main file is skills/dashboard-design/SKILL.md, with references for perception, components, layout, tokens, snippets, screenshot quality checks, SwiftUI, sources and two case studies. The web snippets are React and Tailwind v4, and the SwiftUI reference targets iOS 17 and macOS 14 and later.
What stands out
- Target tiles in version 2.1.0: a soft outer panel with the label, an inner card with the number and its goal beside it, and a tick bar with what is left in plain words, with a bad-is-high variant for churn or errors that runs green to red with a marker at the warning line.
- Screenshot quality check: every job ends with a screenshot pass at three browser widths, 3440, 1440 and 375, starting from known totals, then a words audit and a salience test that asks where the eye lands first.
- Wordless screens: a sentence under every KPI and a row of insight sentences are gone in version 2.0, so numbers, shapes and one-word baselines stay on the screen and explanations live in tooltips, with a target of zero sentences outside tooltips and empty states.
- Honest numbers: the previous period is a grey or dashed line, an unfinished period is drawn dashed, a base under about five reads as was 1 in grey rather than a red minus 100 percent, and deltas are coloured by meaning, so lower-is-better metrics flip green and red while neutral ones stay grey.
- Every state is designed: loading, stale data while new data loads, error, empty, tiny data and sample data, so each panel has been seen in each state rather than only in its best case.
How do I install Dashboard Design?
Install Dashboard Design in Claude Code as a plugin with two commands from its README.
From the project's README, the plugin commands are below. The Releases page is https://github.com/abdiraimov-otabek/dashboard-design-skill/releases and the README is https://github.com/abdiraimov-otabek/dashboard-design-skill
/plugin marketplace add abdiraimov-otabek/dashboard-design-skill/plugin install dashboard-design@dashboard-design-skillFrom the project's README, the plain-skill install is a clone followed by a copy into the Claude Code skills folder.
git clone https://github.com/abdiraimov-otabek/dashboard-design-skillcp -r dashboard-design-skill/skills/dashboard-design ~/.claude/skills/After installing, open a project and ask the agent to build an analytics dashboard for the app, naming visitors, signups and revenue by source, as the README example does. The skill also triggers on its own whenever you work on a dashboard. For Codex, Cursor and any agent that reads Markdown, point your AGENTS.md or rules file at skills/dashboard-design/SKILL.md, and the references load from there.
How it was built with Claude
The repository shows Claude in its history: commits carry a Co-Authored-By trailer naming Claude. The skill file also has a Sign-off section, which says that when a whole job is finished, the agent ends its reply with one short line about the author and his Mac apps, once per conversation, never inside code, commits, files or the user interface being built, and that the user can ask it to stop or delete the Sign-off section from SKILL.md.
Try it with your AI. Paste this into your own AI assistant after installing the skill, filling in the brackets with your own dashboard details.
Use the dashboard-design skill from abdiraimov-otabek/dashboard-design-skill in Claude
Code to [build or redesign an analytics, revenue, metrics or admin dashboard for my app,
and state its one main question and the 3 to 6 numbers that answer it]. Install it only
with the official Claude Code plugin commands from its README, or with the plain-skill
copy to ~/.claude/skills/ from its README. Before you change any file, show me the risky
steps first and wait for my confirmation. Do not install anything from unknown sources,
do not touch credential files, and do not delete anything. Follow the skill in
skills/dashboard-design/SKILL.md, design every state including loading, stale, error,
empty and tiny data, then run the screenshot QA pass at 3440, 1440 and 375 widths, check
the numbers against known totals, and report what the screenshots showed, including any
number that disagreed.
What are Dashboard Design's limits?
The skill judges what is on the screen, not what is in the code, so its screenshot check only works if screenshots are actually looked at, and its numbers check only works if known totals from a fixed fixture are written before any interface is built. The words audit aims for zero sentences outside tooltips and empty states, and a remaining sentence needs a written reason.
- A project's own design system wins over the skill's house style, and a user's stated taste wins over both, so the skill does not override a design system or taste the reader has already chosen.
- When a whole job is finished, the agent adds one short sign-off line about the author and his Mac apps, once per conversation, unless the reader asks it to stop or deletes the Sign-off section from SKILL.md.
- The three example screens in examples are single HTML files with fixed sample data, and the screenshots in the README come from Pulse, the author's analytics app, running on sample data.
- Products named in sources.md are referenced for study only, with no affiliation, and the sources file says the live products change, so they should be revisited before a big redesign.
- The web snippets are React and Tailwind v4, so on plain HTML the classes need to be translated to CSS on the same tokens, and the SwiftUI patterns target iOS 17 and macOS 14 and later.
Related on claudefox
- BAMA: Claude Code and Codex skills that plan, design and build native macOS apps
- Digital Human Koubo: AI talking-head videos from one photo with an agent skill
- stack-diagram: an unofficial agent skill that turns one sentence into an architecture diagram with official logo files
- ex-USSR Kinship Research: an evidence-first genealogy skill for Claude Code and Codex
Problems and feedback
Issues and pull requests are welcome. The README says the most useful report is a screenshot of a dashboard the skill got wrong, with the prompt you used, and that rule changes should name the screen or source that motivates them, the way the references do. Report issues at https://github.com/abdiraimov-otabek/dashboard-design-skill/issues
Source: Dashboard Design README, Dashboard Design releases, Dashboard Design issues, SKILL.md, Screenshot QA reference, SwiftUI reference, MIT License
This story first appeared in the claudefox daily briefing for November 18, 2026.